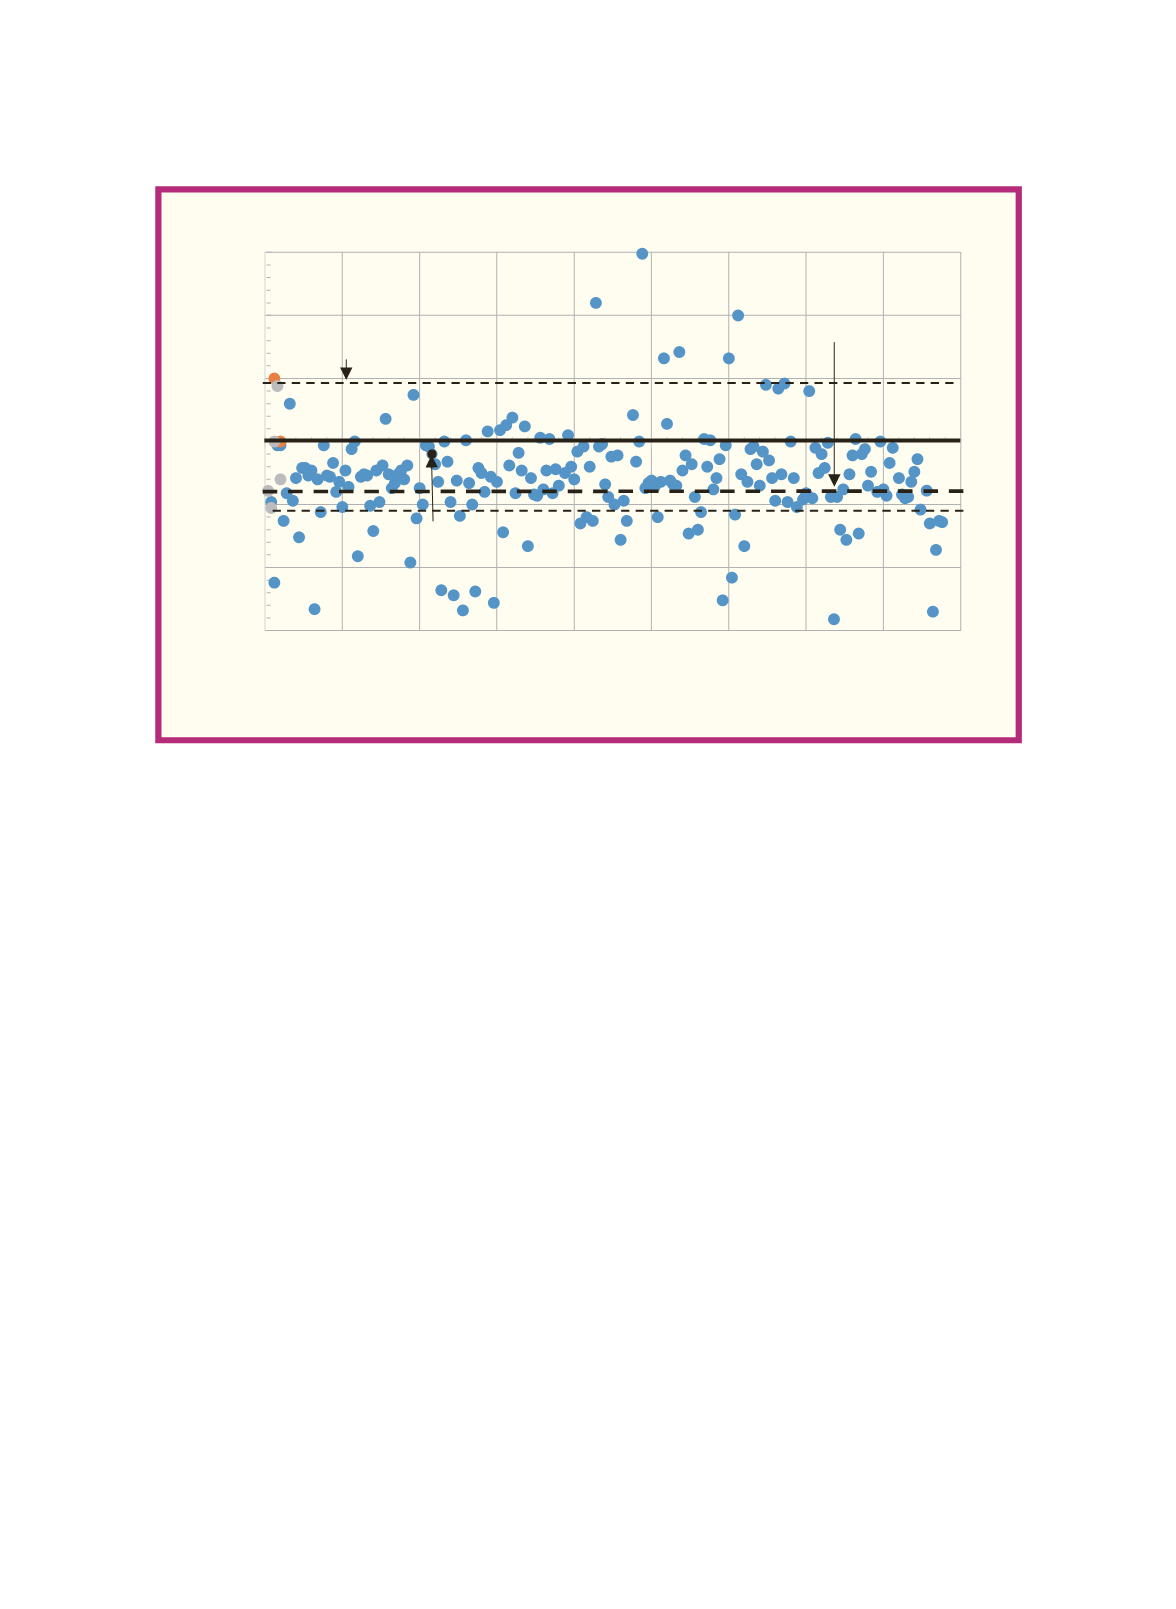
Figure 3 summarizes the scatter diagram in a frequency distribution of the
ratios of all countries in the world. The interval is taken with the range of 10% and
the number below the axis shows the interval which is closed on the right (that
is, in the interval (-2 ~ -1], where -1 is included in the interval, but -2 is not). As
shown above, the world median is -2.9% (shared by Armenia and UAE). Taiwan
(circled along the horizontal axis) had a 1.0% budget deficit (that is –1.0%) in
Interval #13, ranked at 55
th
if the data are arranged from largest (surplus) to
smallest (deficit) as shown along the horizontal axis. There are 20 countries
inside the interval of –2% to –1%, and Taiwan had the smallest deficit among
them.
Sources: World Factbook (2016a). Figure drawn by the author
Figure 2. Budget Surplus and Deficit as Percentage of GDP
2015 Estimate, 219 Countries/Regions
-15
-10
-5
0
5
10
15
0
25
50
75
100
125
150
175
200
225
Percent
Country
Twn
-0.1, #55
Deficits, 186 countries
Avg -5.3% Med -3.4%
Surpluses, 28 countries,
Avg 4.4% Med 2.0%
World 219 countries
Average -3.9%
Median -2.9%
96


