政策
民間
專題
國發
經濟
名家
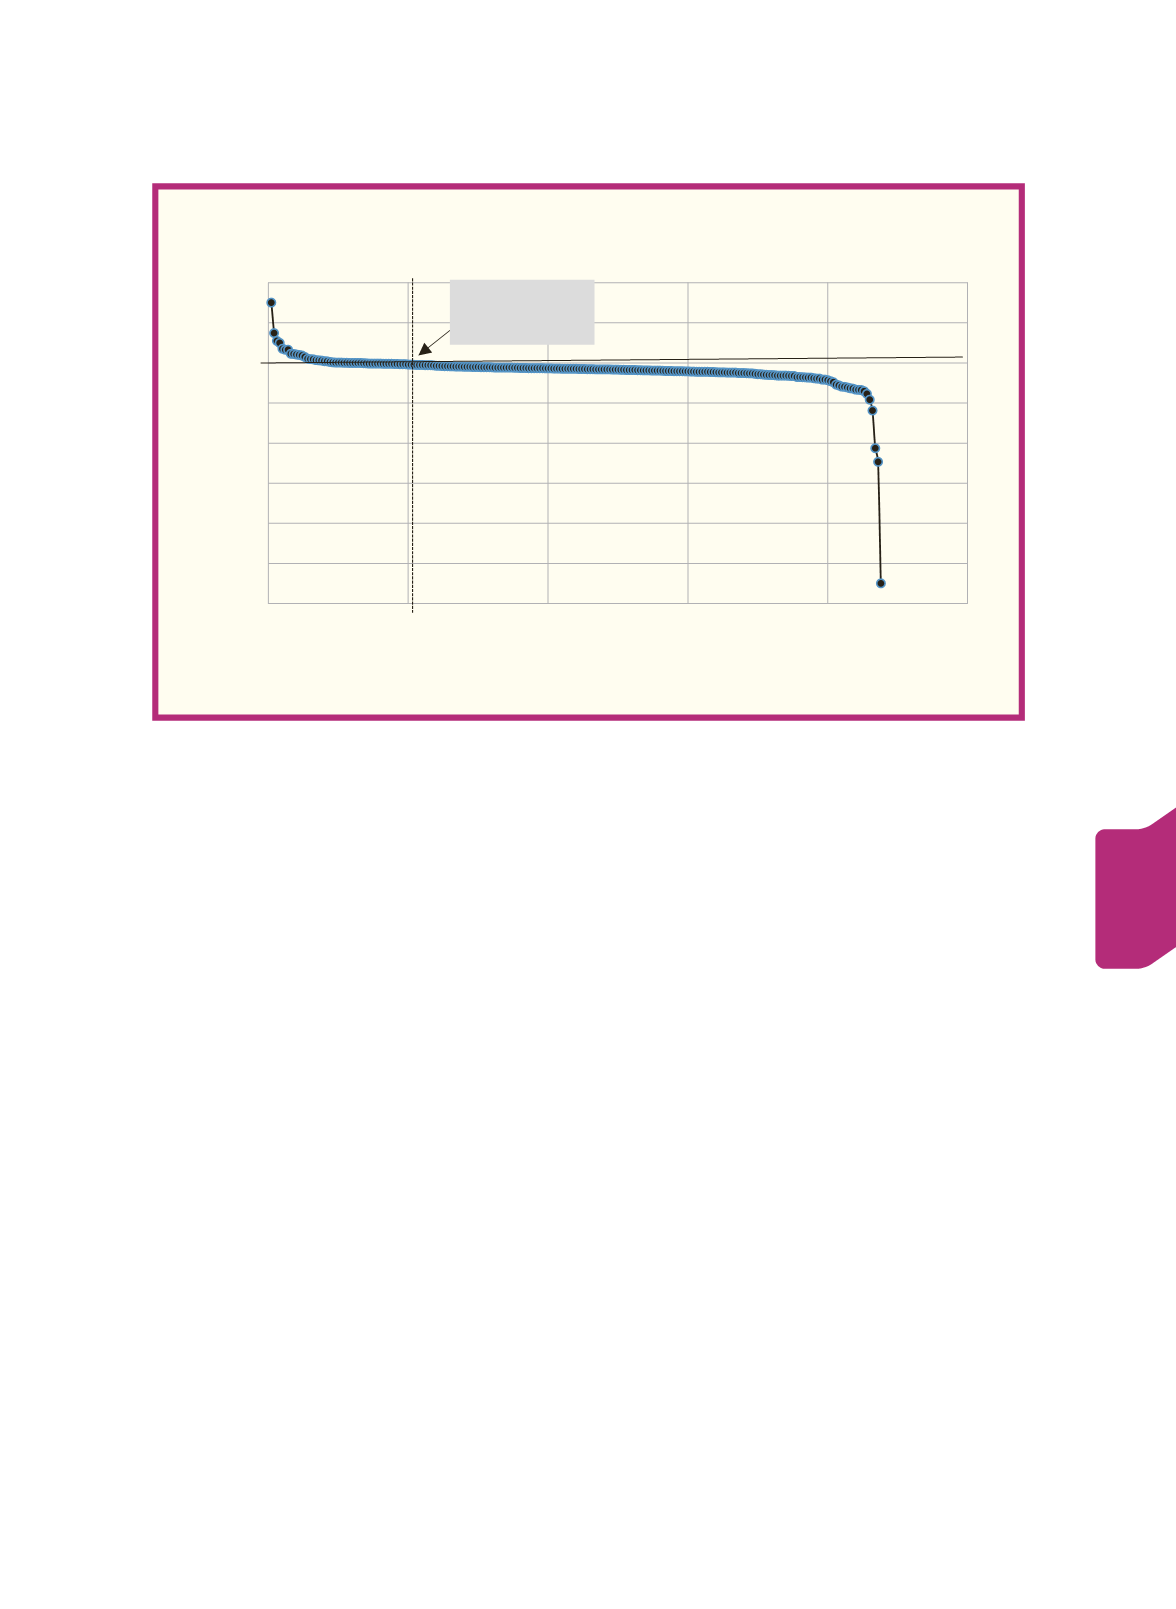
Figure 2 shows the scatter diagram of the ratios ranging from -15% to 15%,
excluding the outliers. The pattern of the chart shows clearly that fewer countries
have a surplus budget, much fewer countries have a balanced budget, and the
majority of the countries have a deficit budget. Thus, a balanced budget is an
exception rather than the rule. In fact, the enclosed box of Figure 3 shows that
the world average ratio is -3.9% and the median is -2.9%. As shown in Table A1
in Appendix A, only five countries out of 219 countries (2.3% of 219) achieved
a balanced budget in 2015. Similarly, only 28 countries (12.8%) had budget
surpluses with an average surplus of 4.4% of GDP, and the median of 2%,
ranging from 0.1% to 30.1%. The other 186 countries (85% of 219) had a deficit
in 2015, with an average of -5.3% and median of -3.4% of GDP, ranging from -1%
to -109.9%.
Sources: World Factbook (2016a). Figure drawn by the author
Figure 1. Fiscal Surplus and Deficit as Percentage of GDP
219 Countries/Regions, 2015
-120
-100
-80
-60
-40
-20
0
20
40
0
50
100
150
200
250
Percent
Country
30.1Tuvalu #1
14.9 Macau #2
Taiwan
-1%, #55
# 219 Venezuela -110
#215 Saudi Arabia -18.3
# 216 Afganistan -23
#217 timor-Leste -42.5
#218, Libya, -49.3
95
Taiwan Economic Forum
Volume 14, Number 4


