3. International Comparison of Taiwan's public Debt
Another method of financing government expenditure is public debt. Figure
4 shows the scatter diagram of the percentage of public debt to the country
GDP measured in the national currency of 178 countries in the world, arranged
according to the increasing public debt ratios. The dataset was downloaded from
the CIA World Factbook (2016).
According to the CIA explanation at the website, "Public debt compares
the cumulative total of all government borrowings less repayments that are
denominated in a country's home currency. Public debt should not be confused
with external debt." Most of the countries have estimated values for 2015, only
Sources: World Factbook (2016a). Figure drawn by the author.
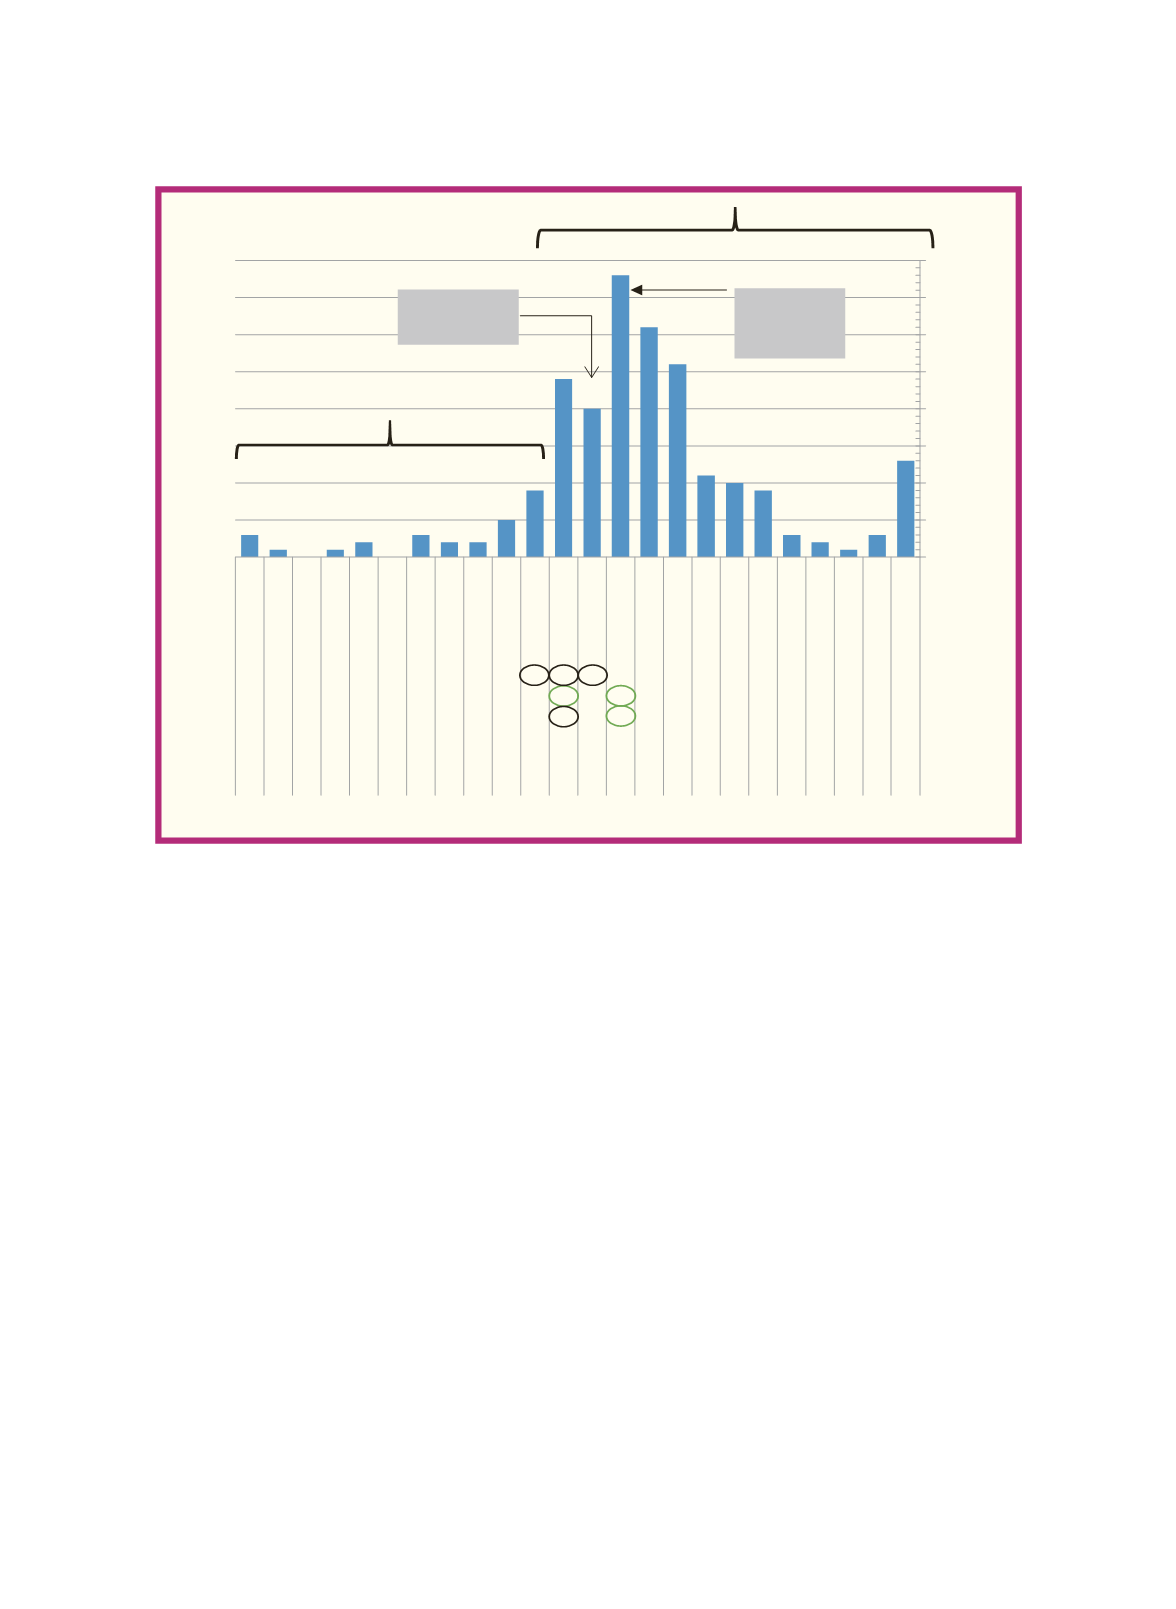
Figure 3. Budget Surplus and Deficit as Percentage of GDP
219 Countries/Regions, CIA 2015 Estimate
13
3
12 3
9 10 11
26
31
38
20
24
9
5
2
2
3
0
2
1
0
1
3
0
5
10
15
20
25
30
35
40
Number of Countries
Surplus countires 28Percentage Interval (right end closed)
Deficit Countires 186
Taiwan,
-0.1%, #55
i
,
World
Avg = -3.9
med= -2.9
5
Avg 4.4 Med 2.0
Avg -5.3 Med -3.4
Surplus countires 28
Ind
UK
EU Ido
Tw Ne
1 2 3 4 5 6 7 8 9 10 11 12 13 14 15 16 17 18 19 20 21 22 23 24
HK
Ge
Sg
.
10&+
9~10
8~9
7~8
6~7
5~6
4~5
3~4
2~3
1~2
0~1
-1~0
-2~-1
-3~-2
-4~-3
-5~-4
-6~-5
-7~-6
-8~-7
-9~-8
-10~-9
-11~-10
-12~-11
UpTo~12
Ph
Ko
It Fr
Jn
Ma Th
US
Ch
Ru
. . . . . . .
. .
.
. . . . . .
98


