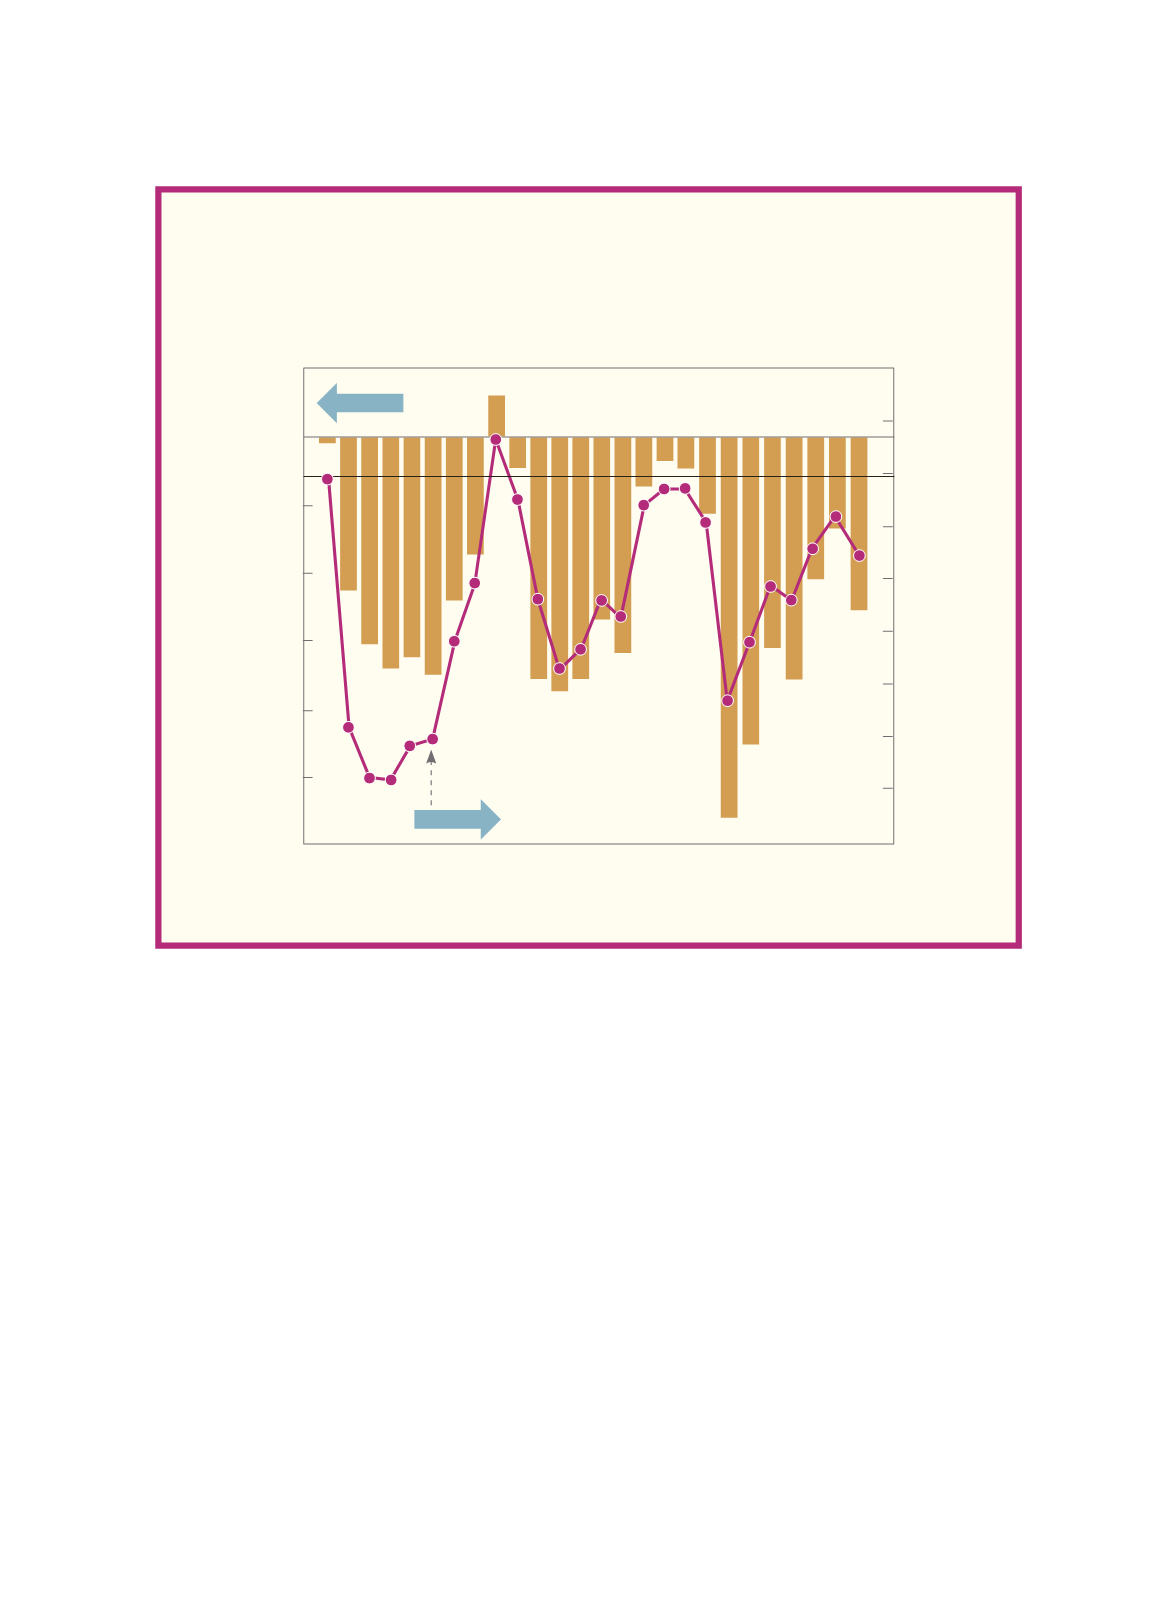
Figure B2 shows the time series from 1999 to 2014 on Taiwan's government
Debt in NT$ billions (the columns), and its GDP ratio (the solid line). While the
debt ratio increased greatly from about 10% in year 2000 to almost 30% in 2001,
it has been increasing slowly since 2012 to less than 35% in recent years.
Notes: Net budget revenue excludes revenue from government bond issuance and borrowing, and surplus form
previous fiscal years; net budget expenditure excludes debt principal repayments. For other details see
NDC (2015), 32-33.
Source: Figure taken from NDC (2015), pp. 32-33.
Figure B1 Taiwan's Government Budget Deficit to GDP Ratio
1992-2013
Budget surplus/deficit
to GDP ratio
NT$ 100 millions
Budget Surplus/Deficit
1,000
0
-1,000
-2,000
-3,000
-4,000
-5,000
-6,000
2.0
1.0
0.0
-1.0
-2.0
-3.0
-4.0
-5.0
-6.0
-7.0
%
1992 1995 1998 2001 2004 2007 2010 2013
Ratio
112


