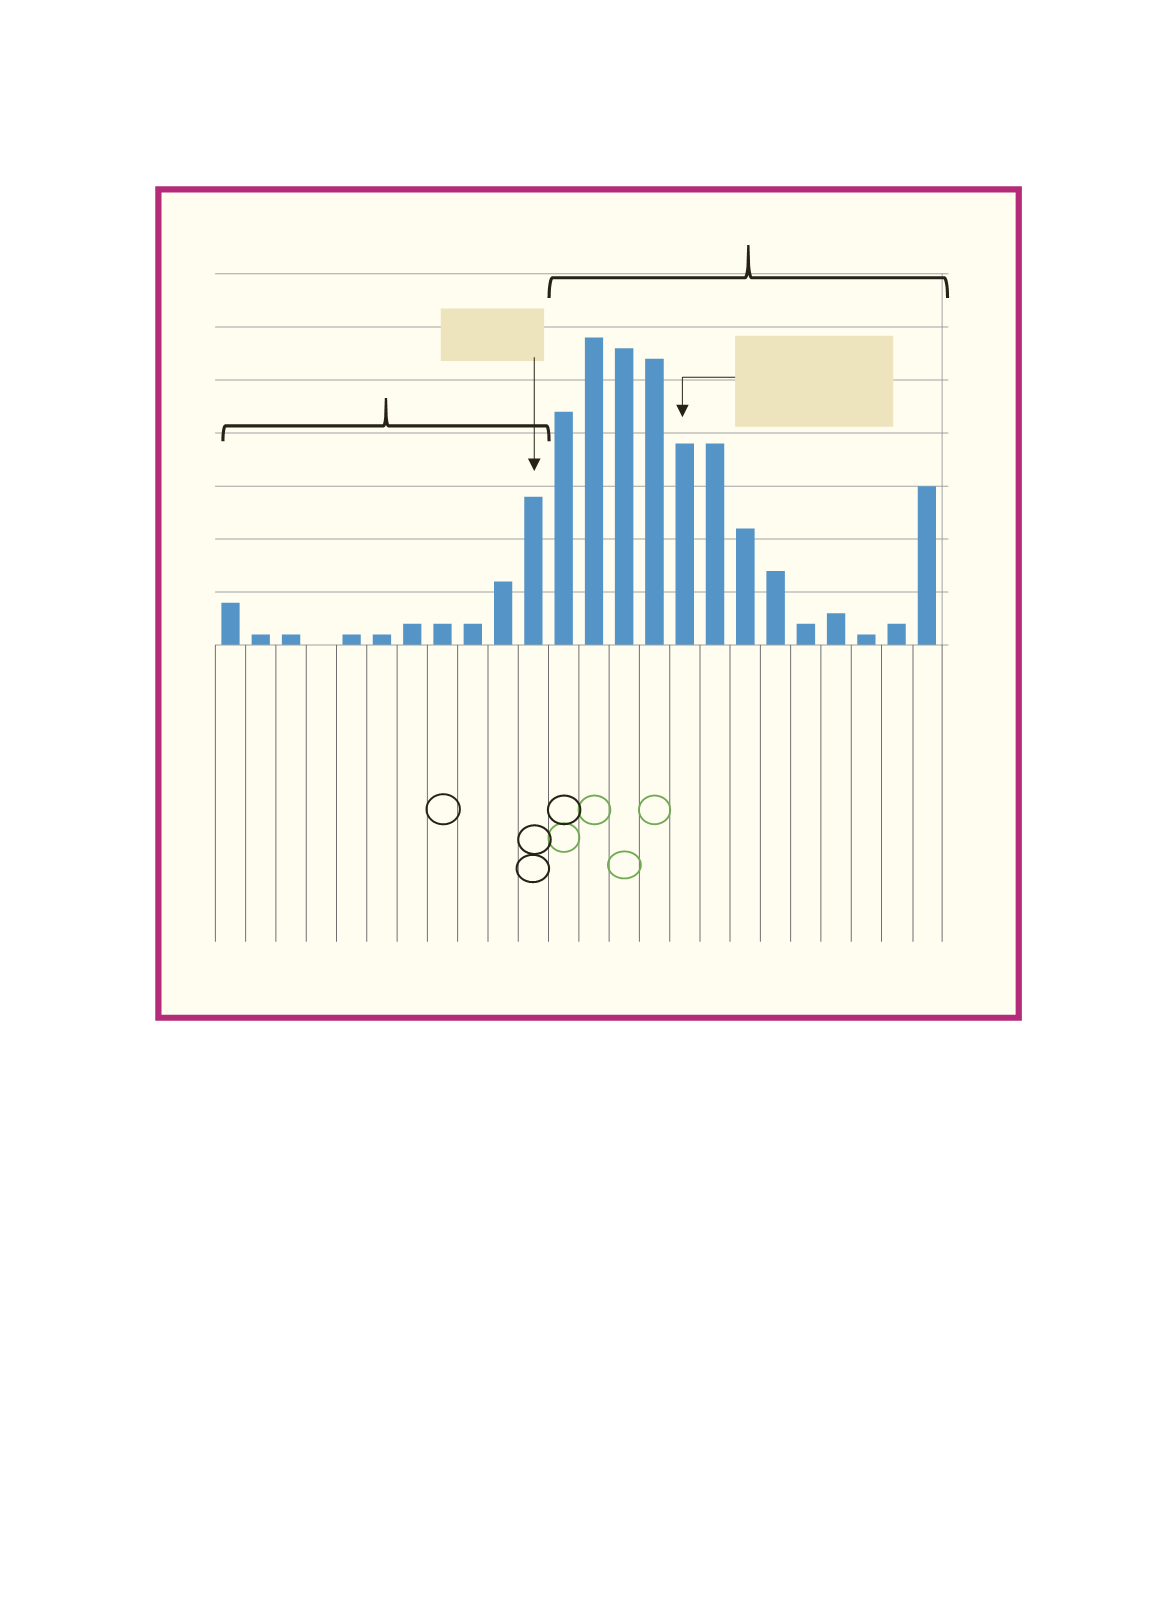
Source: World Factbook (2016a). Figure drawn by the author. Also see Appendix A.
Figure A1 Budget Surplus or Deficit as Percentage of GDP
219 Countries/regions, CIA November 2015 revised estimate
UK Ch Ru
Th US
Ne
15
2 1
3 2
7
11
19 19
27 28 29
22
14
6
22
2
1
1
0
11
1 2 3 4 5 6 7 8 9 10 11 12 13 14 15 16 17 18 19 20 21 22 23 24
Ge
Tw
Sg
HK
4
0
5
10
15
20
25
30
35
Number of Countries
Percentage Interval (right end closed)
Deficit Countires
Taiwan,
0.1, #34
Surplus countires
Avg 3.7, Med 1.4
Avg-5.6, Med-3.5
10&+
9~10
8~9
7~8
6~7
5~6
4~5
3~4
2~3
1~2
0~1
-1~0
-2~-1
-3~-2
-4~-3
-5~-4
-6~-5
-7~-6
-8~-7
-9~-8
-10~-9
-11~-10
-12~-11
-12&less
Ph
Ko
Ma Ind Jn
Fr
Ido
It
World
Average -4.0
Median -2.85
. . . . . . .
. .
. . . . . . .
110


