3 .
˴
ࠅ
ʈ
ุ
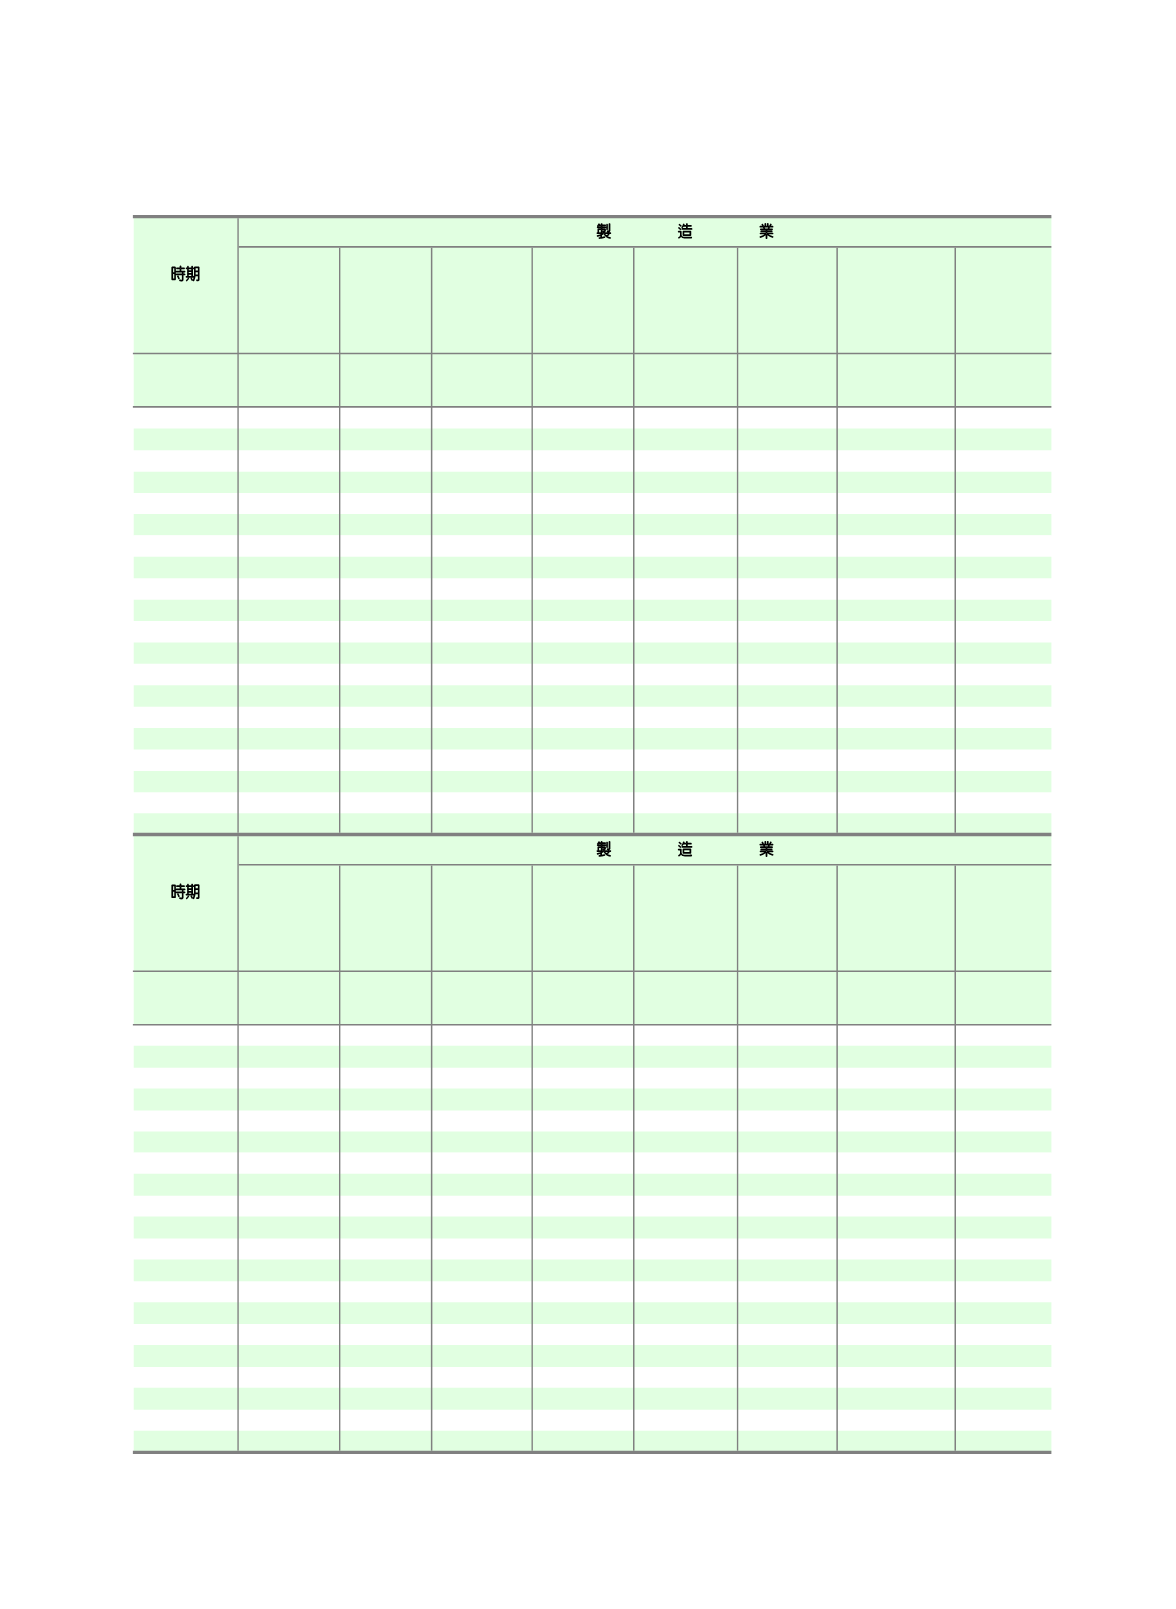
Output of Principal
3.
主
要
工
業
Output of Principal
飼料
Feedstuff
啤
酒
Beers
茶類飲料
Tea drinks
聚酯加工絲
Polyester
textured
yarn
聚酯絲織布
Polyester
textured
yarn
fabrics
針織及梭
織成衣
Knitted
& woven
Apparels
瓦楞紙箱
Corrugated
paperboard
container
印刷品
Printed
matter
Unit
公噸
mt
公秉
kl
千公升
1,000 l
公噸
mt
千平方公尺
1,000 m
2
千打
1,000 doz.
千平方公尺
1,000 m
2
百萬元
N.T.$mill.
2013
5,098,034 378,035 1,147,023 674,977 1,086,270
4,607
2,904,796
57,563
2014
5,160,507 380,097 1,167,477 671,935 1,108,686
4,793
3,023,252
56,604
Sept.
436,843 38,780 115,048
52,484
90,434
386
247,320
4,475
Oct.
468,762 32,087
91,826
57,600
99,507
401
261,229
5,474
Nov.
435,536 22,369
82,684
57,885
95,562
391
241,722
5,032
Dec.
467,000 29,358
73,452
58,291
100,181
458
269,908
5,051
2015
5,071,362 380,043 1,146,488 668,166 1,087,873
4,559
3,022,467
54,227
Jan.
439,066 15,782
79,533
58,974
97,210
457
264,819
4,768
Feb.
377,216 22,948
67,516
51,053
73,868
359
192,080
3,301
Mar.
409,020 29,724
95,302
59,929
105,849
393
266,369
4,718
Apr.
403,306 32,547
90,804
57,532
96,707
382
256,592
4,829
May
384,445 32,201
95,770
57,746
87,129
311
248,408
4,317
June
399,664 43,549 114,212
53,276
82,906
337
255,294
4,237
July
430,358 41,547 124,680
54,677
88,716
367
274,091
4,526
Aug.
432,781 40,398 121,159
51,694
87,568
341
243,275
4,337
Sept.
433,198 32,102
97,119
52,772
88,864
433
234,094
4,324
Oct.
465,477 30,833
95,567
58,887
98,475
408
259,991
4,925
Nov.
430,421 26,024
80,319
55,978
84,587
375
247,990
4,978
Dec.
466,410 32,388
84,507
55,648
95,994
396
279,464
4,967
2016 Jan.
431,976 23,700
86,668
55,760
91,753
341
267,851
4,683
鋼胚
Steel ingot
鋼筋
Re-bar
熱軋鋼捲板
H.R. plate
and coil
螺絲、螺帽
Screw and
nut
IC
製造
IC
manufacture
晶圓代工
Foundry
wafer
構裝
IC
IC package
印刷電路板
Printed
circuit
board
Unit
公噸
mt
公噸
mt
公噸
mt
公噸
mt
千個
1,000 pcs.
千片
1,000 pcs.
千個
1,000 pcs.
千平方呎
1,000 sq.ft
2013
21,466,231 5,671,611 17,577,778 1,312,930 4,058,783
23,534 59,893,085
956,285
2014
22,511,346 5,871,207 17,875,950 1,412,194 4,277,202
27,241 70,008,825 1,037,176
Sept.
1,807,992 453,726 1,509,526 118,273
392,005
2,436
6,405,728 106,765
Oct.
2,027,570 530,065 1,417,507 127,483
404,540
2,482
6,152,031 109,887
Nov.
2,017,783 553,505 1,418,157 112,348
348,502
2,439
6,150,839 109,887
Dec.
2,040,645 577,018 1,427,454 125,012
360,756
2,384
5,788,951
93,844
2015
20,817,450 5,480,132 16,338,485 1,327,899 4,322,907
28,100 69,224,518 961,291
Jan.
1,987,611 553,194 1,400,300 118,278
352,210
2,462
5,393,415
98,387
Feb.
1,741,323 416,781 1,226,178
90,115
324,120
2,207
5,016,467
70,062
Mar.
2,010,706 535,926 1,419,338 123,360
348,649
2,593
5,965,492
94,007
Apr.
1,802,432 485,614 1,341,064 116,961
315,743
2,450
5,720,409
90,244
May 1,836,921 476,124 1,448,130 111,126
340,023
2,450
5,822,272
72,493
June 1,742,064 434,263 1,417,303 117,414
379,670
2,405
5,952,794
63,479
July 1,788,995 435,902 1,552,910 120,419
402,751
2,416
5,993,744
77,075
Aug.
1,645,744 419,068 1,545,403 106,795
402,167
2,352
5,912,316
72,479
Sept.
1,535,808 370,199 1,316,445 106,288
364,427
2,227
6,067,363
79,368
Oct.
1,648,263 434,467 1,254,720 104,708
386,353
2,176
6,058,894
81,278
Nov.
1,493,207 446,812 1,215,849 100,203
358,540
2,164
5,771,950
86,302
Dec.
1,584,376 471,782 1,200,845 112,232
348,254
2,198
5,549,402
76,117
2016 Jan.
1,719,621 461,612 1,480,595 104,264
365,724
2,203
5,341,699
62,562
Source: See Table 2.
Note: Owing to economic development and changes in the industrial structure, the base period of the Indices of Industrial
Production was changed from 2006 to 2011, starting from May 2013. Also, to better respond to economic trends and
changes in the industrial structure, major emerging products with potential for development were included in the statistics.
90
時期
PERIOD
製
造
業
時期
PERIOD
製
造
業
154


