1 .
ၽ
ᝄ
ࠠ
ࠅ
Major Indicators of
1.
臺
灣
重
要
Major Indicators of
平均
average
期底
end of
period
2000
4.625
106,742 31.2252 32.9920 140,732.0
26.6 151,949.8
22.8
2001
2.125
122,211 33.8003 34.9990 107,970.6
-23.3 126,314.3
-16.9
2002
1.625
161,656 34.5752 34.7530 113,245.1
4.9 135,316.7
7.1
2003
1.375
206,632 34.4176 33.9780 128,010.1
13.0 150,600.5
11.3
2004
1.750
241,738 33.4218 31.9170 168,757.6
31.8 182,370.4
21.1
2005
2.250
253,290 32.1671 32.8500 182,614.4
8.2 198,431.7
8.8
2006
2.750 266,148
32.5313 32.5960
202,698.1
11.0 224,017.3
12.9
2007
3.375 270,311
32.8418 32.4430
219,251.6
8.2 246,676.9
10.1
2008
2.000 291,707
31.5167 32.8600
240,447.8
9.7 255,628.7
3.6
2009
1.250 348,198
33.0495 32.0300
174,370.6
-27.5 203,674.6
-20.3
2010
1.625 382,005
31.6422 30.3680
251,236.4
44.1 274,600.6
34.8
2011
1.875 385,547
29.4637 30.2900
281,437.6
12.0 308,257.3
12.3
2012
1.875 403,169
29.6140 29.1360
270,472.6
-3.9 301,180.9
-2.3
2013
1.875 416,811
29.7699 29.6200
269,896.8
-0.2 305,441.2
1.4
2014
1.875 418,980
30.3678 31.7180
281,849.7
1.5 320,092.1
2.7
May
1.875 421,651
30.1772 30.0500
22,005.1
0.6 27,178.7
3.3
June
1.875 423,454
30.0285 29.9150
25,610.2
10.5 27,452.4
3.6
July
1.875 423,661
29.8941 30.0400
24,959.7
13.1 27,297.7
7.9
Aug.
1.875 423,066
30.0366 29.9700
24,551.7
16.7 28,585.1
11.5
Sept.
1.875 420,696
30.1546 30.4360
23,419.0
2.3 26,930.8
6.7
Oct.
1.875 421,476
30.4316 30.4780
23,044.7
2.0 27,372.3
2.5
Nov.
1.875 421,466
30.7929 31.0390
23,102.4
8.1 27,287.1
6.1
Dec.
1.875 418,980
31.4506 31.7180
21,630.5
-10.5 26,154.4
-0.9
2015
1.625 426,031
31.8983 33.0660
237,219.1
-15.8 285,343.6
-10.9
Jan.
1.875 415,903
31.6855 31.5550
21,107.8
-1.1 25,490.8
4.9
Feb.
1.875 417,826
31.5665 31.5030
15,684.1
-20.4 20,171.0
-5.2
Mar.
1.875 414,689
31.5258 31.4010
21,937.6
-14.9 25,643.0
-7.6
Apr.
1.875 418,174
31.1305 30.7520
19,295.7
-19.8 23,801.7
-10.5
May
1.875 418,958
30.7169 30.8710
20,733.1
-5.8 26,024.3
-4.2
June
1.875 421,411
31.1127 31.0700
21,451.9
-16.2 23,384.7
-14.8
July
1.875 421,956
31.3430 31.6820
20,544.0
-17.7 23,833.0
-12.7
Aug.
1.875 424,791
32.3872 32.8100
20,836.4
-15.1 24,412.3
-14.6
Sept.
1.750 426,325
32.8888 33.1280
18,054.4
-22.9 22,978.9
-14.7
Oct.
1.750 426,774
32.7272 32.8020
18,714.5
-18.8 24,450.5
-10.7
Nov.
1.750 424,611
32.8018 32.8300
20,457.5
-11.4 22,604.7
-17.2
Dec.
1.625 426,031
33.0060 33.0660
18,402.0
-14.9 22,548.7
-13.8
2016 Jan.
1.625 425,978
33.6441 33.6500
18,676.3
-11.5 22,191.5
-12.9
Feb.
-
-
33.5519
-
13,627.6
-13.1 17,782.4
-11.8
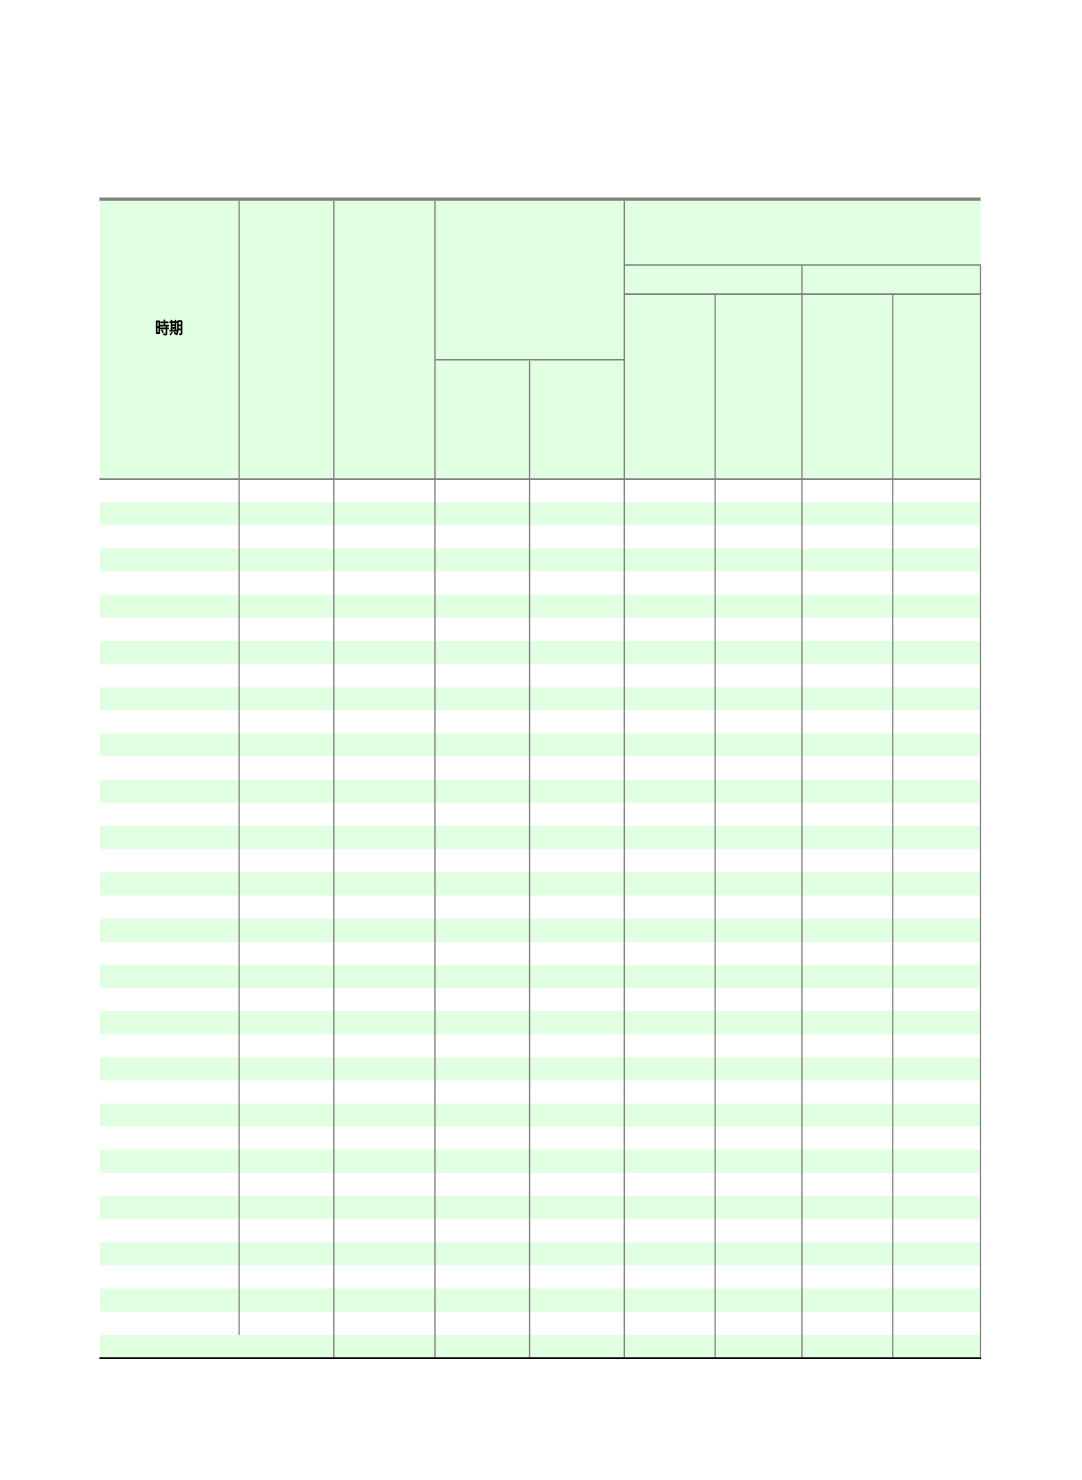
時期
PERIOD
中央銀行
重貼現率
(
年息
百分率
)
Rediscount
Rate of
Central
Bank of
China (%
per annum)
中央銀行
外匯存底
(
期底數
)
百萬美元
Foreign
Exchange
Reserves of
Central Bank
of China (end
of period,
US$ million)
新台幣匯率
(
新台幣/美元
)
Exchange Rate
of the NT$
(NT$/US$)
海關對外貿易統計
(
百萬美元
)
Merchandise Trade (customs statistics, US$
與上年
比較
%
% change
from
previous
year
金額
amount
金額
amount
與上年
比較
%
% change
from
previous
year
進口
Imports (c.i.f.)
出口
Exports (f.o.b.)
150


