政策
政策
特別
經建
活動
政策
臺灣
經濟
ܸ
ᅺ
Taiwan Economy
經
濟
指
標
Taiwan Economy
製造業
Manu-
facturing
61.86
6.71 100.00
1.98
29.09 23.76 68.93 89.82 1.25
89
年
56.66
-8.41 100.00
1.85
27.62 22.73 70.53 89.82 -0.01
90
年
60.88
7.45 100.00
1.82
30.38 25.02 67.80 89.64 -0.20
91
年
66.42
9.10 100.00
1.71
31.20 26.13 67.08 89.39 -0.28
92
年
72.59
9.29 100.00
1.68
31.75 26.81 66.57 90.83 1.61
93
年
75.00
3.32 100.00
1.67
31.26 26.53 67.08 92.92 2.30
94
年
78.60
4.80 100.00
1.61
31.33 26.46 67.06 93.48 0.60
95
年
84.70
7.76 100.00
1.45
34.04 29.59 64.51 95.16 1.80
96
年
83.73
-1.15 100.00
1.55
32.09 28.27 66.36 98.51 3.52
97
年
77.11
-7.91 100.00
1.68
31.99 27.21 66.33 97.66 -0.86
98
年
95.75
24.17 100.00
1.60
33.99 29.29 64.41 98.60 0.96
99
年
100.00
4.44 100.00
1.72
33.02 28.66 65.27 100.00 1.42
100
年
99.75
-0.25 100.00
1.67
32.75 28.37 65.58 101.93 1.93
101
年
100.40
0.65 100.00
1.70
33.20 28.37 65.10 102.74 0.79
102
年
106.80
6.37 100.00
1.88
34.07 29.08 64.05 103.97 1.20
103
年
110.21
5.82
103.90 1.62
5
月
107.88
8.57 100.00* 2.05* 35.15* 30.47* 62.80* 104.43 1.64
6
月
112.53
6.33
104.40 1.76
7
月
110.50
6.88
104.85 2.07
8
月
108.74
9.94 100.00* 1.56* 36.34* 31.11* 62.10* 104.80 0.71
9
月
112.79
9.20
104.88 1.06
10
月
107.40
6.79
103.92 0.85
11
月
112.03
7.76 100.00* 1.75* 34.17* 29.81* 64.08* 103.56 0.60
12
月
104.93
-1.75 100.00
1.80
35.41 30.34 62.79 103.65 -0.31
104
年
108.07
6.74
102.29 -0.94
1
月
90.20
2.17
102.65 -0.20
2
月
111.89
6.81 100.00* 1.67* 35.09* 30.10* 63.25* 102.41 -0.62
3
月
106.44
1.13
102.89 -0.82
4
月
106.47
-3.39
103.14 -0.73
5
月
106.67
-1.12 100.00* 1.90* 36.10* 31.11* 62.00* 103.84 -0.56
6
月
109.43
-2.75
103.74 -0.63
7
月
103.97
-5.91
104.39 -0.44
8
月
102.66
-5.59 100.00* 1.72* 36.70* 31.14* 61.58* 105.11 0.30
9
月
105.69
-6.29
105.20 0.31
10
月
102.24
-4.80
104.47 0.53
11
月
105.48
-5.85 100.00* 1.91* 33.80* 29.04* 64.29* 103.70 0.14
12
月
101.60
-5.99
103.11 0.80 105
年
1
月
86.91
-3.65
105.11 2.40
2
月
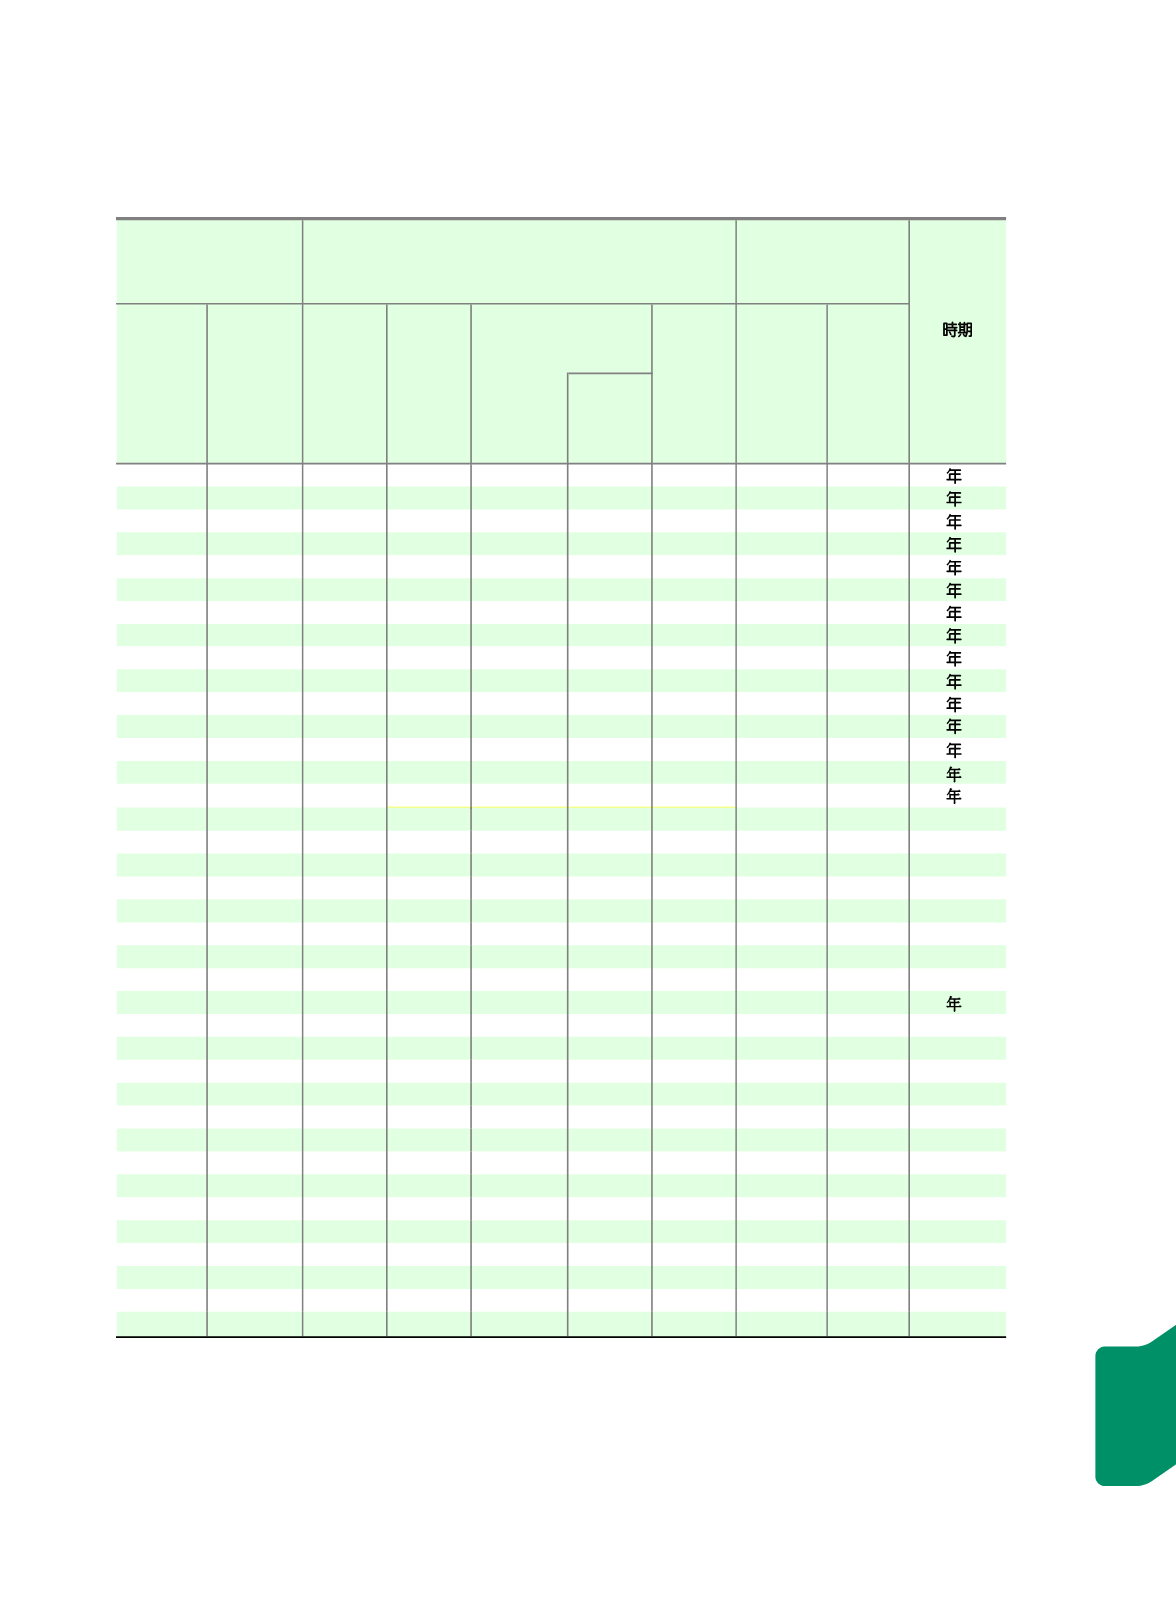
註:
(3)
因應經濟發展及產業結構變遷,工業生產指數基期自民國
102
年
5
月起由民國
95
年修訂為民國
100
年。
(4)
配合工商普查及相關最新調查結果,國民所得統計資料基期自民國
96
年起修訂為民國
100
年。
*
季資料
(1)
月或季變動率係與上年同期增減百分比
(%)
。
(2)
實質
GDP
成長率。
時期
PERIOD
總指數
General
Index
民國
100
年
=100
2011=100
(3)
農業
Agri-
culture
工業
Industry
服務業
Services
總指數
General
Index
民國
100
年
=100
2011=100
與上年
比較
%
%
change
from
previous
year
工業生產
Industrial Production
產業結構
(
占
GDP%)
Structure of Industry (as % of GDP)
(4)
消費者物價
Consumer Prices
合計
Total
與上年
比較
%
% change
from
previous
year
147
Taiwan Economic Forum
Volume 14, Number 1


