3 .
˴
ࠅ
ʈ
ุ
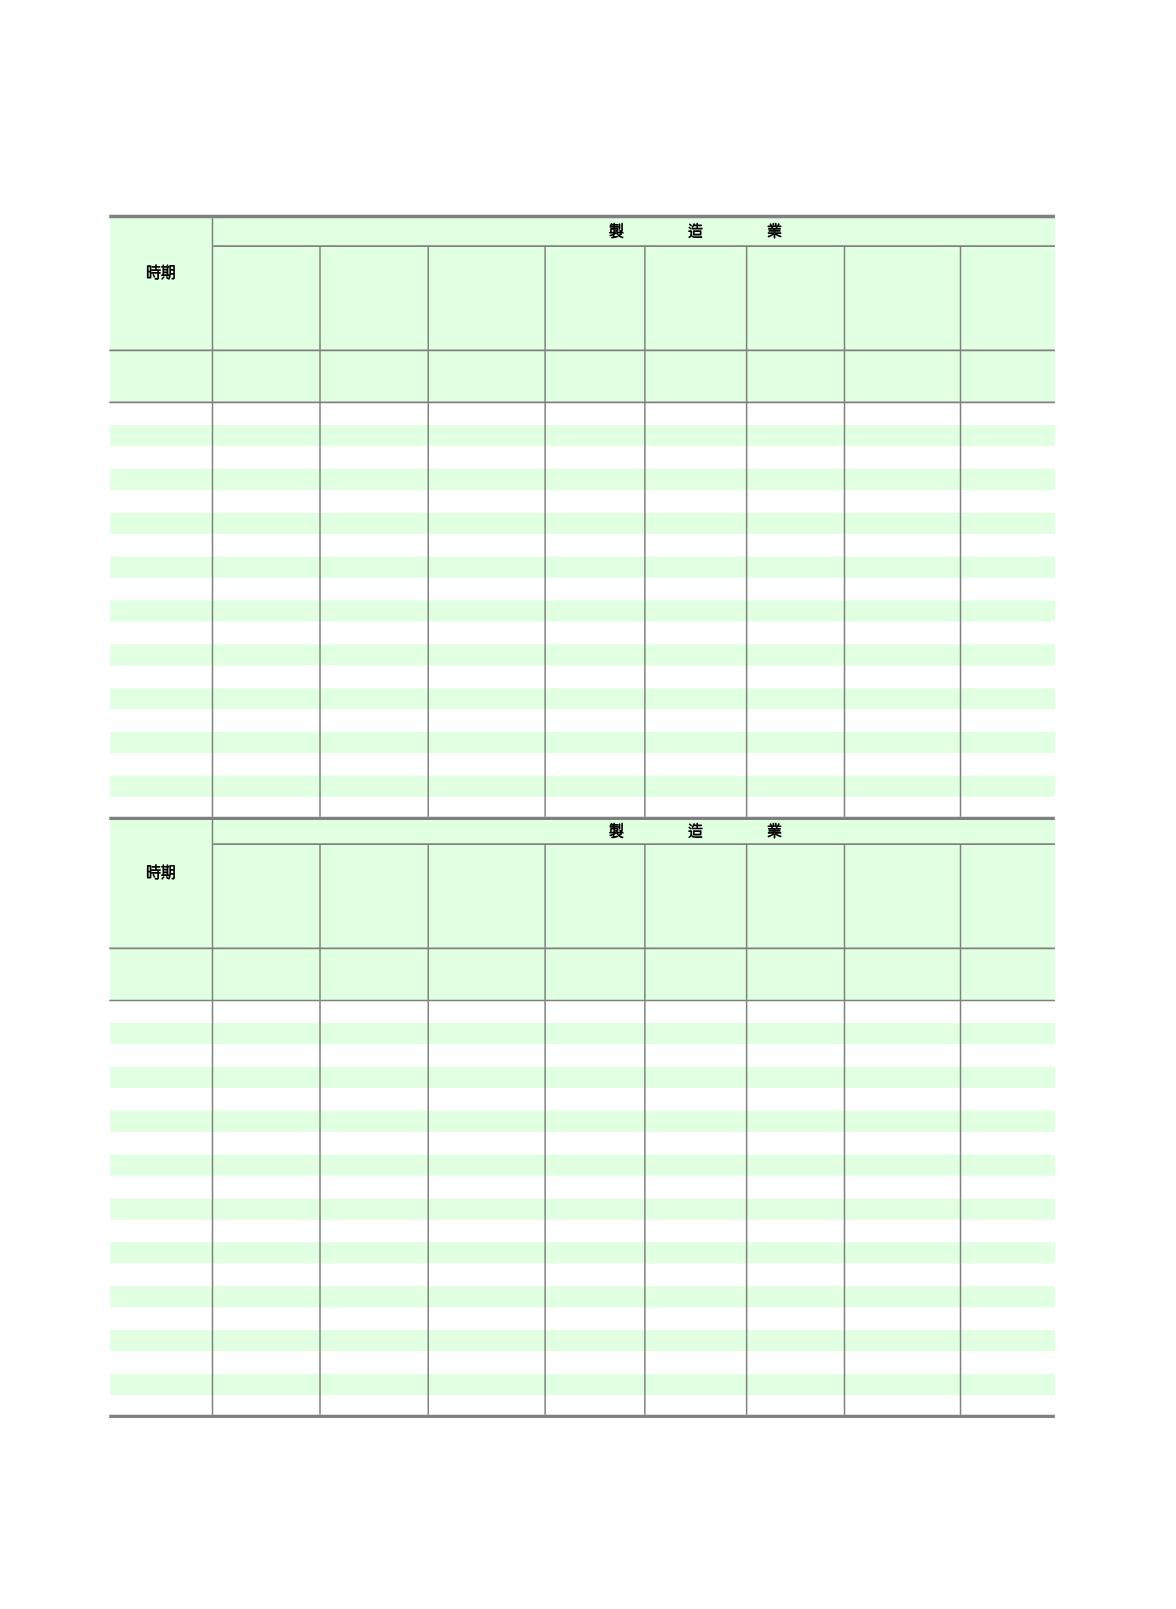
Output of Principal
3.
主
要
工
業
Output of Principal
飼料
Feedstuff
啤
酒
Beers
茶類飲料
Tea drinks
聚酯加工絲
Polyester
textured
yarn
聚酯絲織布
Polyester
textured
yarn
fabrics
針織及梭
織成衣
Knitted
& woven
Apparels
瓦楞紙箱
Corrugated
paperboard
container
印刷品
Printed
matter
Unit
公噸
mt
公秉
kl
千公升
1,000 l
公噸
mt
千平方公尺
1,000 m
2
千打
1,000 doz.
千平方公尺
1,000 m
2
百萬元
N.T.$mill.
2014
5,160,507
380,097
1,167,477 671,935 1,108,686
4,793
3,023,252
56,604
2015
5,072,376
380,046
1,146,488 668,166 1,084,910
4,559
3,023,667
54,227
2016
5,163,009
374,442
1,188,212 645,669 1,017,071
4,363
3,113,785
57,382
July
431,082
40,072
131,616
52,558
83,080
336
268,522
4,655
Aug.
448,358
42,900
120,342
52,814
89,941
342
279,823
4,874
Sept.
429,771
31,361
90,789
51,300
88,251
307
235,092
4,264
Oct.
446,996
29,533
91,341
54,775
87,032
380
255,345
4,994
Nov.
452,143
30,968
94,692
53,924
86,776
441
274,936
5,358
Dec.
471,650
24,413
82,878
56,166
91,414
393
284,027
5,462
2017
Jan.
434,909
257,624
86,232
50,858
72,795
321
255,644
4,203
Feb.
384,478
228,959
65,491
47,123
72,487
268
237,703
3,818
Mar.
444,373
282,841
92,126
52,147
97,060
312
303,315
4,961
Apr.
407,792
260,903
88,888
49,533
81,558
244
246,921
4,410
May
428,832
336,614
111,494
50,966
85,757
304
247,198
4,349
June
436,873
396,184
119,513
47,116
86,524
287
267,462
4,464
July
426,796
351,149
120,852
48,578
82,271
313
259,876
4,755
Aug.
450,735
481,862
129,955
49,775
88,009
315
281,690
4,806
Sept.
429,756
418,162
101,312
48,715
84,103
305
266,304
4,439
Oct.
434,909
278,921
84,019
52,041
86,639
301
249,468
4,869
鋼胚
Steel ingot
鋼筋
Re-bar
熱軋鋼捲板
H.R. plate and
coil
螺絲、螺帽
Screw and
nut
IC
製造
IC
manufacture
晶圓代工
Foundry
wafer
構裝
IC
IC package
印刷電路板
Printed
circuit
board
Unit
公噸
mt
公噸
mt
公噸
mt
公噸
mt
千個
1,000 pcs.
千片
1,000 pcs.
千個
1,000 pcs.
千平方呎
1,000 sq.ft
2014
22,511,346 5,871,207 17,875,950 1,412,194 4,277,202
27,241 70,008,825 721,207
2015
20,817,450 5,480,132 16,338,485 1,327,952 4,322,907
28,100 69,224,518 681,512
2016
20,857,654 4,654,745 18,412,972 1,447,352 4,906,839
31,081 72,252,278 594,853
July
1,776,766
388,597
1,521,960 121,591
430,403
2,666
6,421,409
53,880
Aug.
1,790,555
386,029
1,515,996 131,868
447,086
2,721
6,545,284
66,231
Sept.
1,605,288
334,205
1,386,052 110,016
431,821
3,035
6,465,056
58,724
Oct.
1,840,121
384,815
1,604,877 112,749
462,046
2,770
6,798,949
59,104
Nov.
1,682,064
385,724
1,581,930 125,806
464,677
2,863
6,451,504
57,997
Dec.
1,829,935
427,348
1,521,113 125,449
469,201
2,832
6,471,008
56,312
2017
Jan.
1,780,777
374,590
1,464,840 117,773
497,316
2,699
6,169,057
50,915
Feb.
1,733,387
374,914
1,545,895 105,724
439,891
2,506
5,785,716
44,630
Mar.
1,886,643
435,260
1,654,389 140,680
553,744
2,818
6,217,327
49,833
Apr.
1,869,933
369,874
1,546,852 113,204
464,209
2,607
6,103,254
48,477
May
1,928,256
417,562
1,652,700 121,913
562,017
2,828
6,427,416
48,624
June 1,726,824
340,059
1,262,407 131,449
520,284
2,935
6,691,296
51,101
July
1,713,110
346,881
1,600,804 120,719
551,524
2,952
7,015,263
56,173
Aug.
1,843,399
392,343
1,613,453 137,282
537,957
2,968
7,240,730
70,129
Sept.
1,727,407
358,941
1,526,905 126,473
537,535
2,933
7,266,435
76,049
Oct.
1,712,626
399,521
1,266,129 116,648
586,503
3,070
7,355,485
76,182
Source: See Table 2.
Note: Owing to economic development and changes in the industrial structure, the base period of the Indices of Industrial
Production was changed from 2006 to 2011, starting from May 2013. Also, to better respond to economic trends and
changes in the industrial structure, major emerging products with potential for development were included in the statistics.
時期
PERIOD
製 造 業
時期
PERIOD
製 造 業
150


